
 Search


Pivots visualization
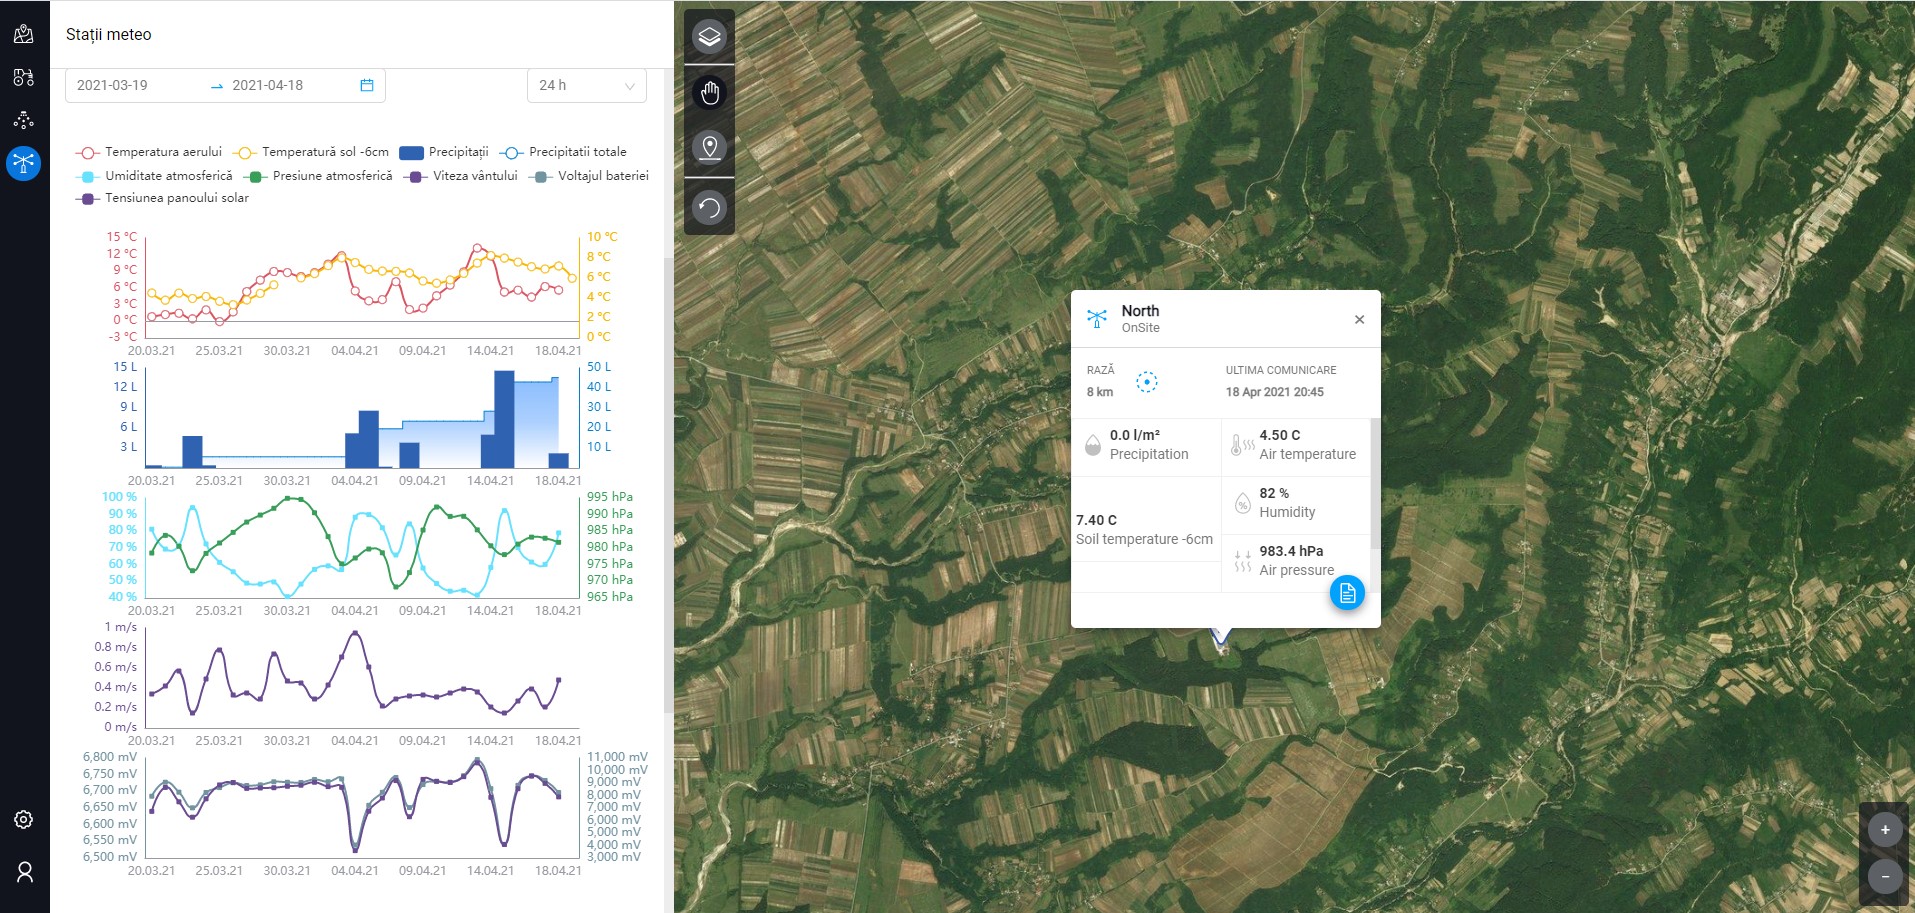
You can view the information provided by all weather stations of the account. The displayed data is a function of the sensors related to each station, real time transmitted or and recorded as history.
The viewing interval can be set to 15 minutes, 1 hour or 24 hours, and the history can be viewed as a report that can be exported in PDF or Excel format.
Contact us to find out more details!

Advantages

Advantages
Advantages
Advantages
Advantages
Advantages
Contact us
 Close
Close


