
 Search


Crops visualization
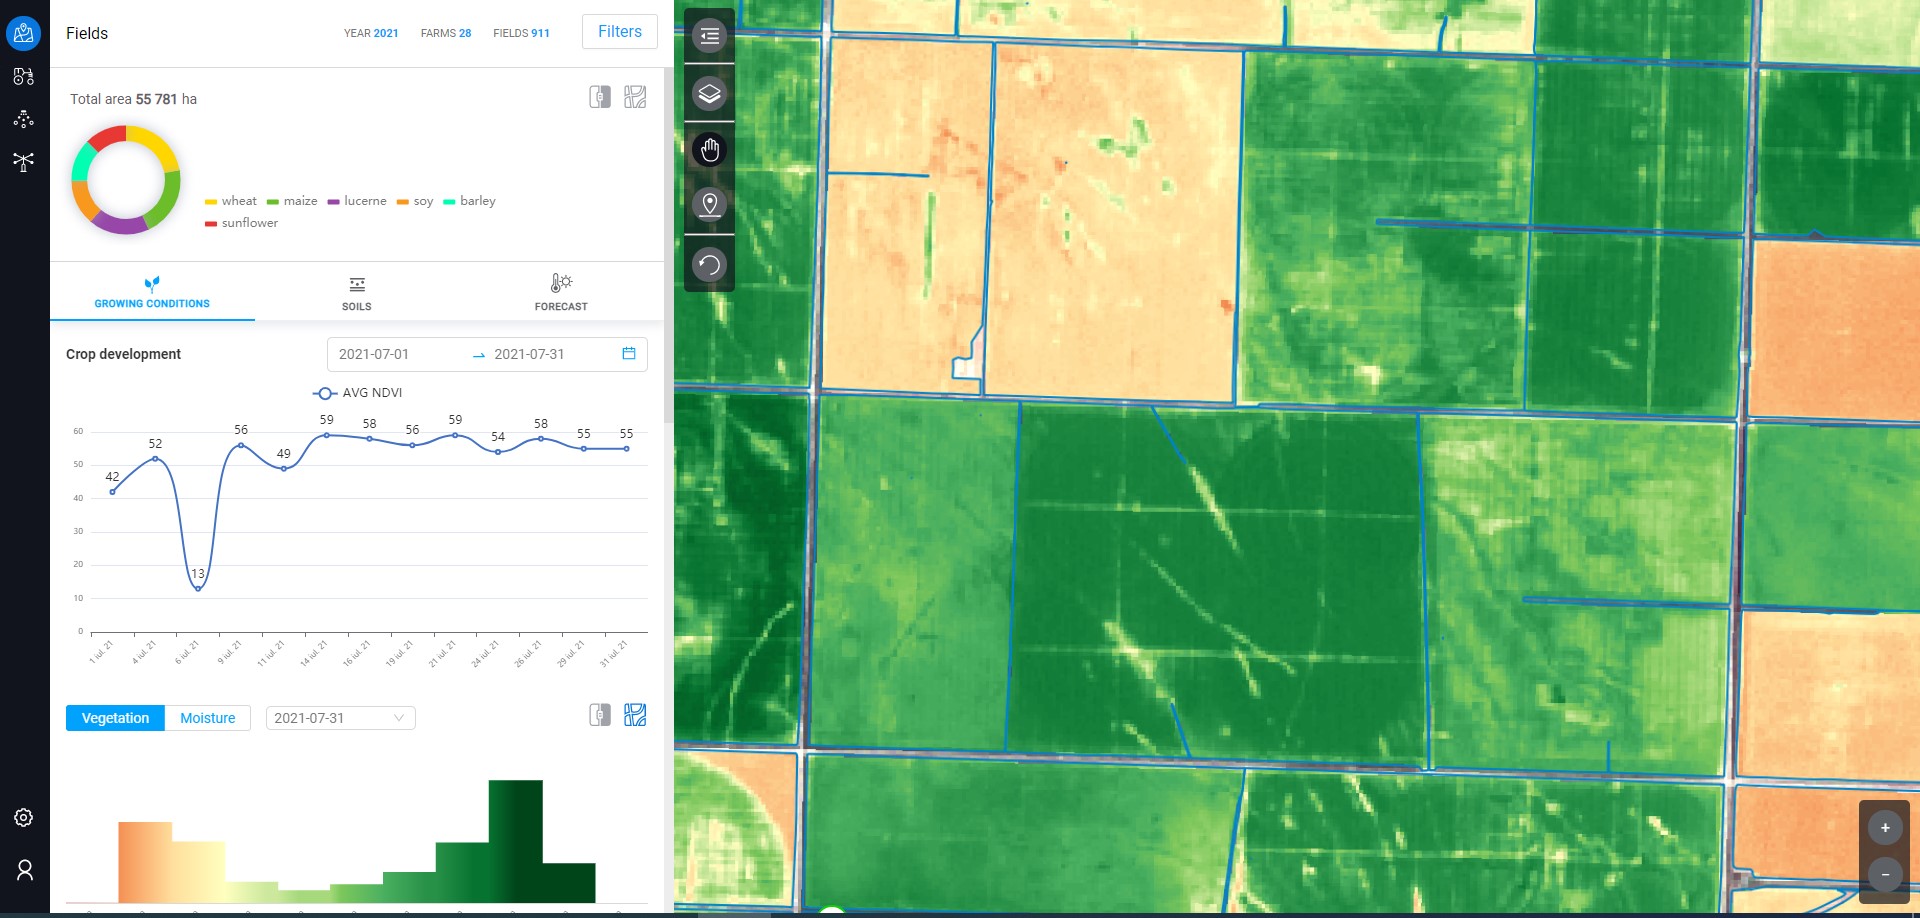
The module allows us to monitor the evolution of the crops throughout the entire agricultural year, highlighting at the plot level the changes produced in plant development. Using satellite images, we get images of the NDVI Vegetation Index (the chlorophyll content of plants) and the NDWI Humidity Index (the relative water content of soil and plants) obtained based on the data collected in the visible and infrared spectrum by sensors located on satellites.
The module also has a function that compares any two images (maps) as well as the possibility to adjust the NDVI index for a better interpretation of the images.
After the agrochemical soil mapping, nutrient distribution maps (Soil Analysis Maps) can be overlapped with NDVI vegetation maps and NDWI relative soil moisture maps, so we can obtain a complete picture of crop evolution throughout the agricultural year and multi -year.
Contact us to find out more details!

Advantages

Advantages
Advantages
Advantages
Advantages
Advantages
Contact us
 Close
Close


