
 Search

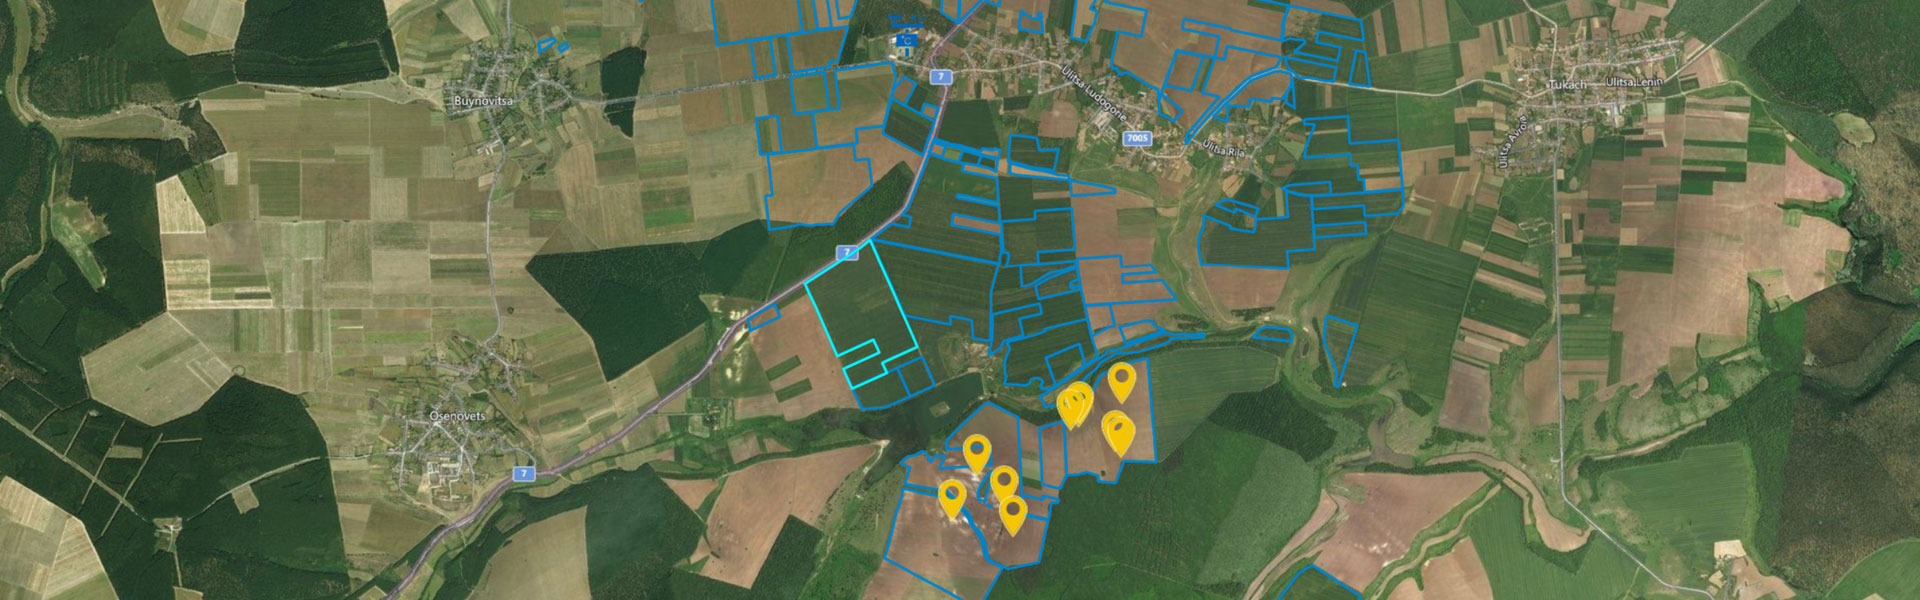
GeoScan is an integrated platform that includes 4 distinct monitoring modules (culture, fleet of machines and equipment, irrigation systems and weather stations), allowing both real-time visualization of parameters and visualization of activities for the selected time periods.
Crop Monitoring
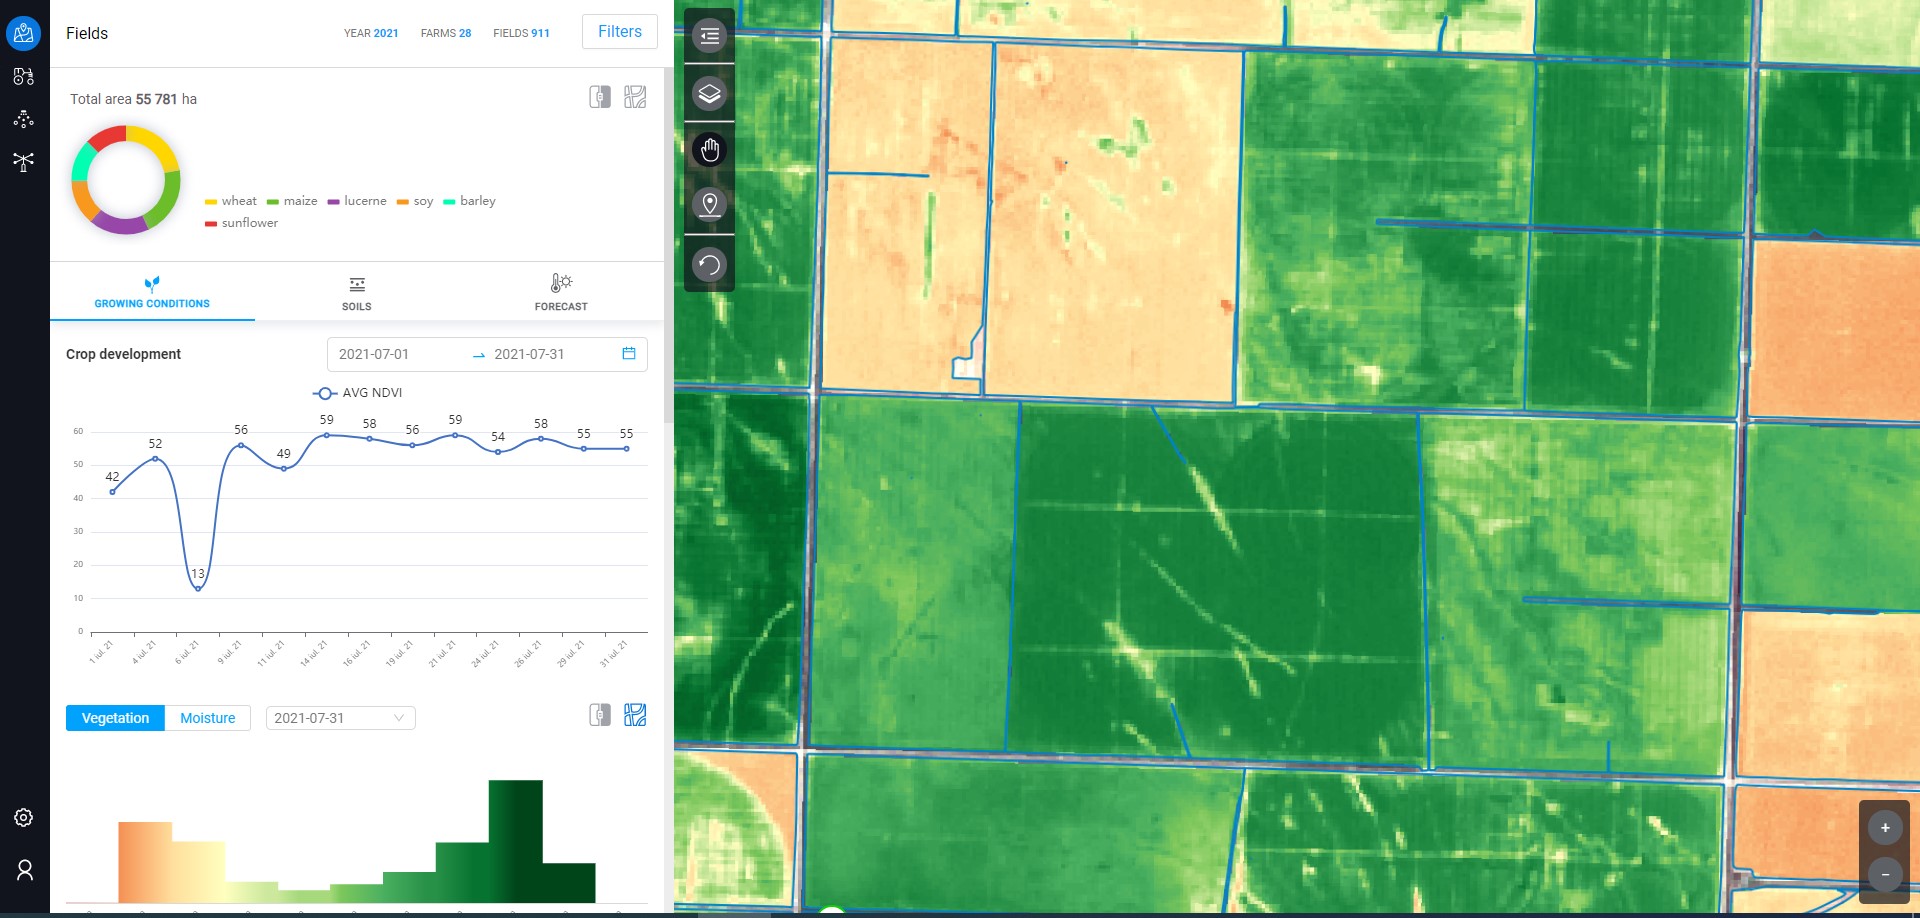
This module allows tracking the evolution of the crops throughout the entire agricultural year, highlighting at the plot level the changes in plant development. Using satellite images we present images of the NDVI Vegetation Index (plant chlorophyll content) and of the NDWI Humidity Index (soil and plant water content) obtained from the data collected in the visible and infrared spectrum by satellite sensors.
The module also has a function to compare any two images (maps) as well as the possibility to adjust the NDVI index for a better interpretation of the images.
Fleet monitoring for machines and equipment
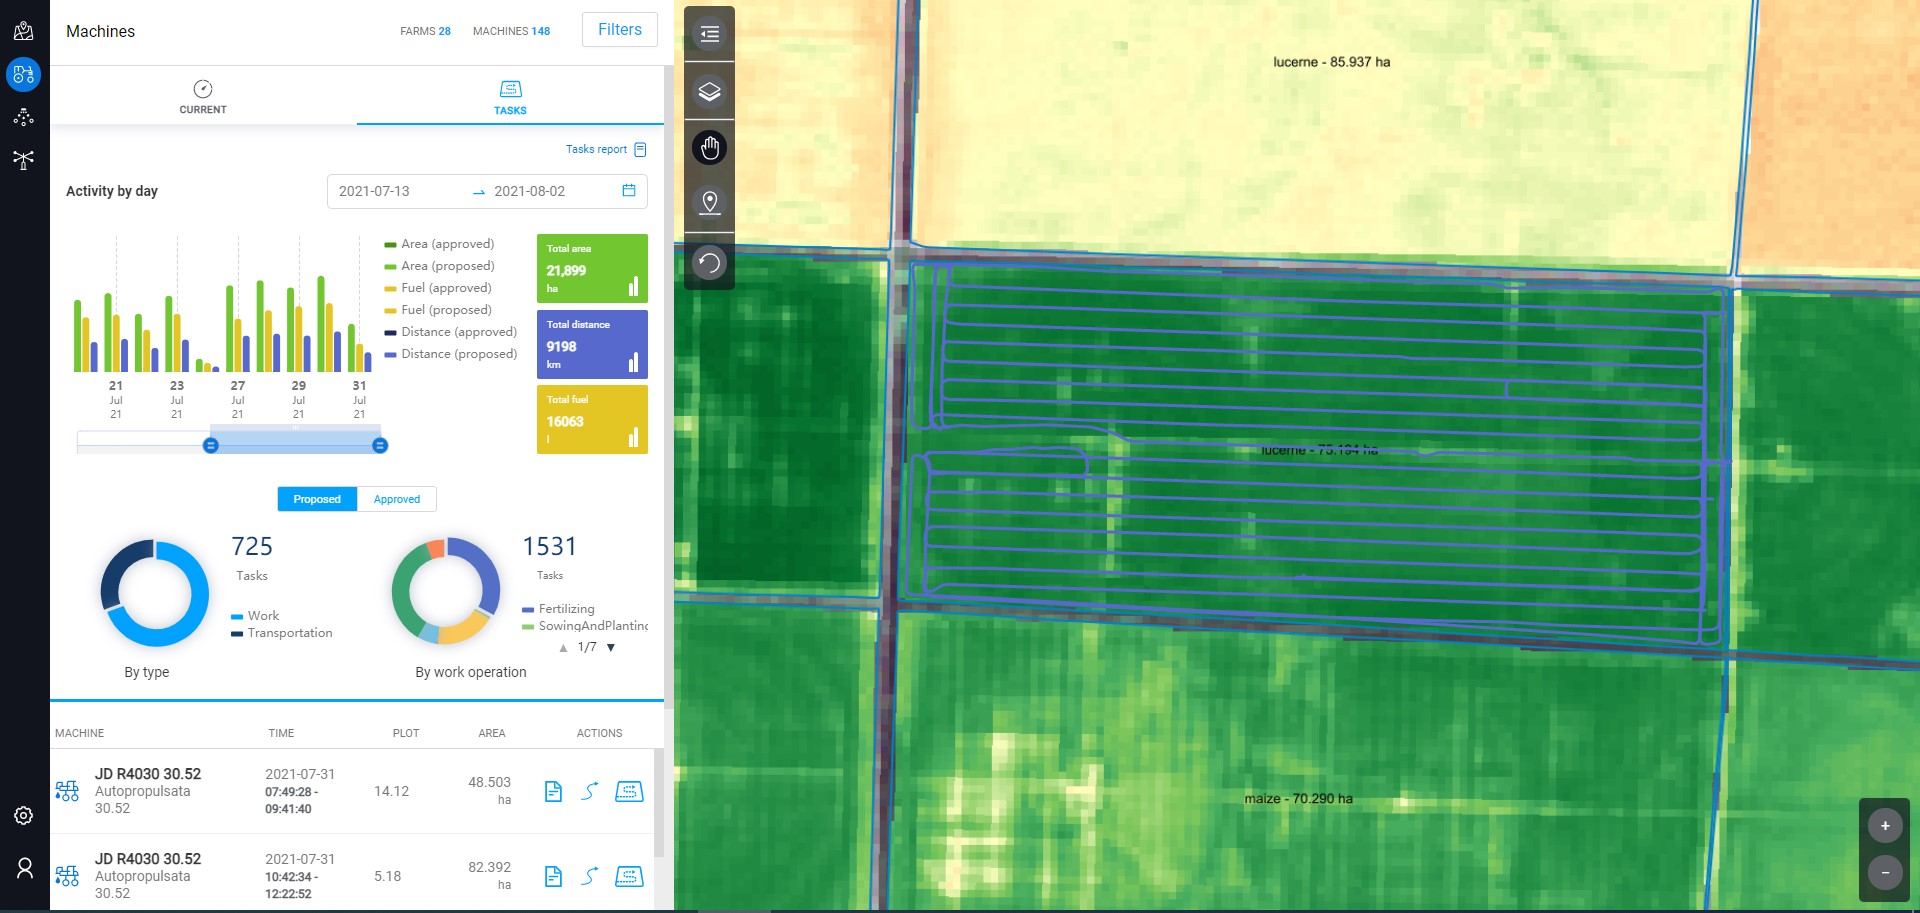
In this module you can automatically view and identify all agricultural machines and equipment (Machine ID), the attached equipment (Implement ID) and drivers who drive them (Driver ID). All this is made automatically eliminating errors due to the intervention of the operator. This visualization is done both in real time and also for certain periods of time regarding the activities with the possibility of generating detailed activity reports(multiple possibilities for data filtering, information about the time worked by each car, driver, attached equipment, the plot in which he worked, the distance covered on the road or in the plot, the surface covered by the works, the fuel consumption in movement or stationary, on the road or working inside the plots, stationary or movement times, etc.).
Irrigation monitoring
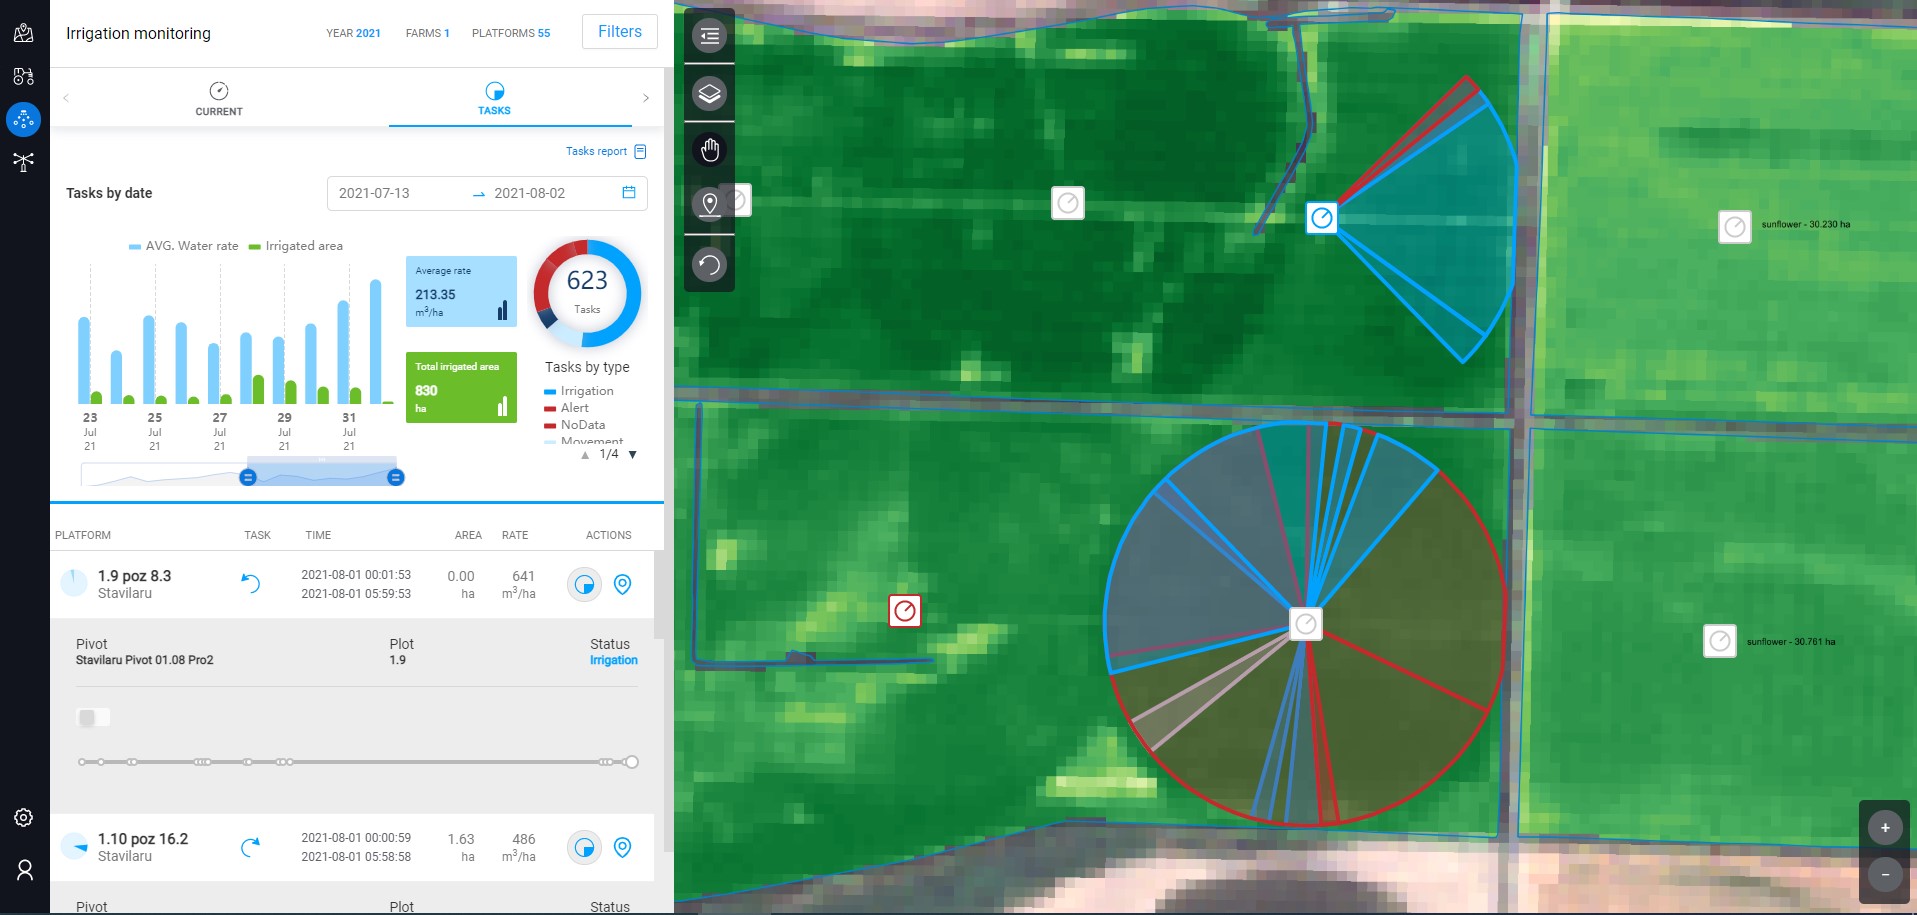
This module allows real-time monitoring of the activity of irrigation systems.
The visualization of the parameters is done in real time, allowing detailed activity reports of the activities performed in certain periods of time on the farm, culture, plot, platform, pivot.
The module offers the possibility to locate (identify the farm, plot, platform, pivot) and view the following parametric: status (active, inactive), water rate, pressure, speed, pivot position, direction of rotation, covered area
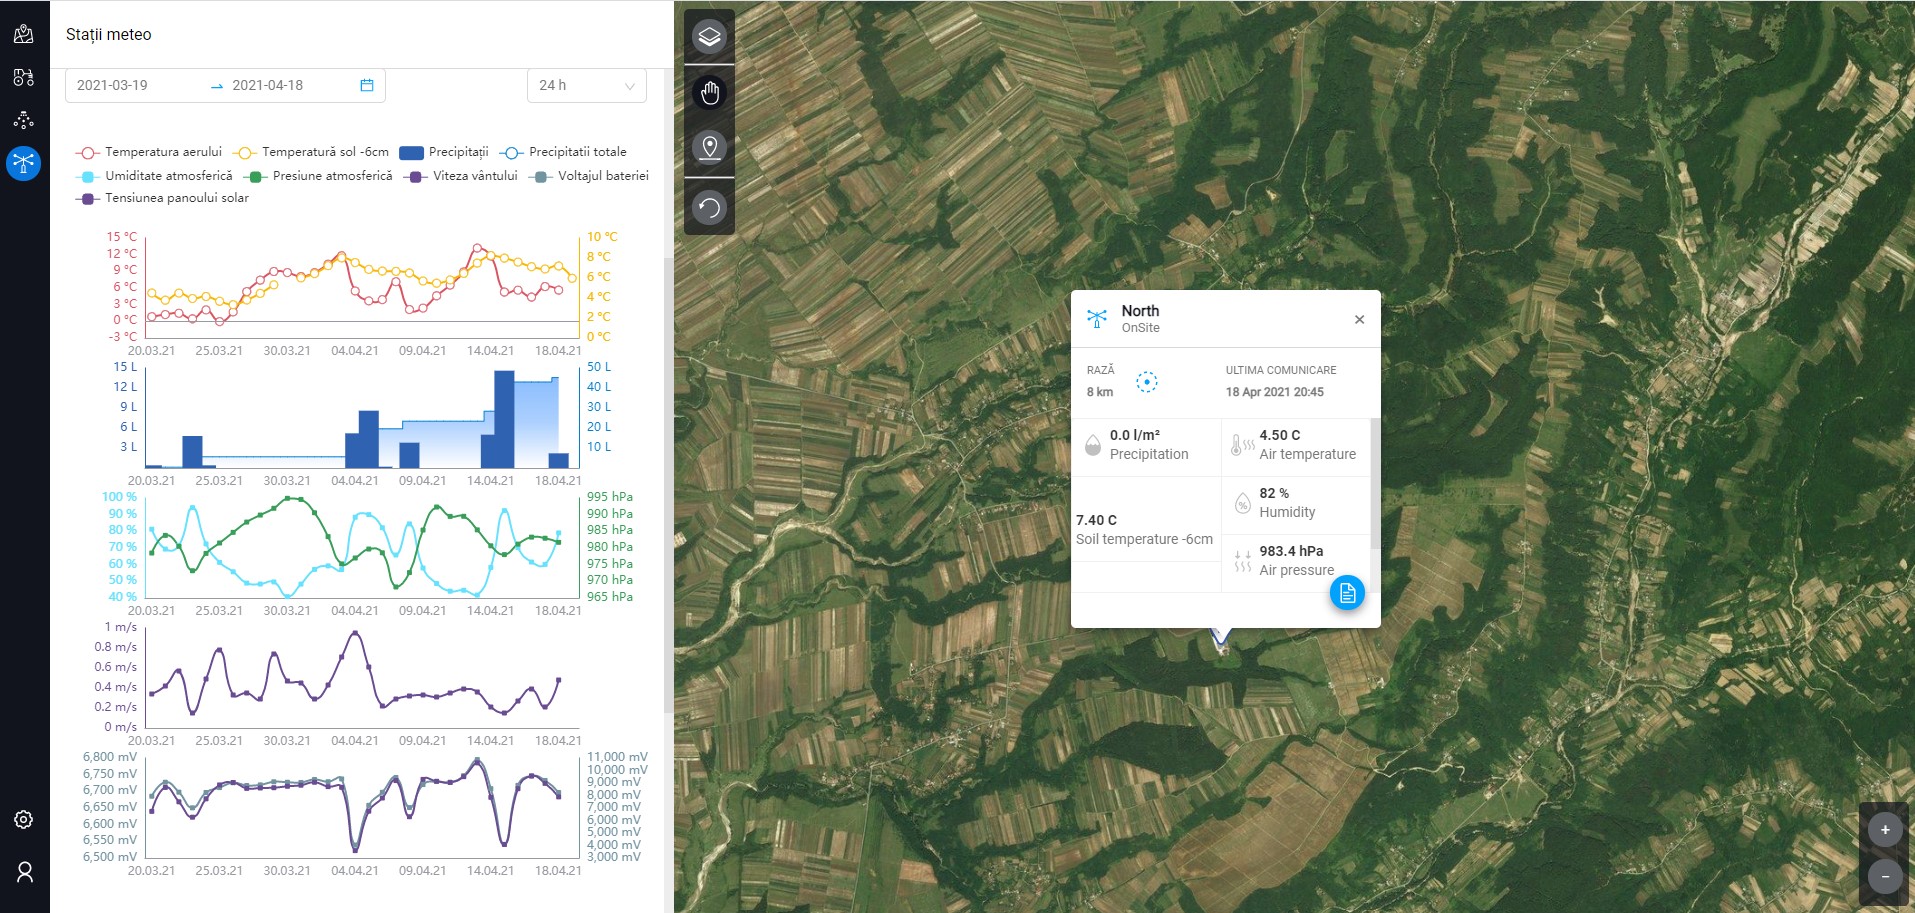
Modul monitorizare stații meteo
You can view the information provided by all weather stations related to the account. The displayed data depends on the sensors related to each station, being both those transmitted in real time and those recorded as historical
The viewing interval can be set to 15 minutes, 1 hour or 24 hours and the history can be viewed as a report that can be exported in PDF or Excel format.
GeoScan is an integrated platform that includes 4 distinct monitoring modules (culture, fleet of machines and equipment, irrigation systems and weather stations), allowing both real-time visualization of parameters and visualization of activities for the selected time periods.
Benefits of GeoScan integrated platform
- Visualization of the information on a single platform
- Visualization with the help of satellite images (NDVI index), of the effect in time of the works carried out by the machines and their equipment
- simultaneous viewing of any two maps: maps of the vegetation index, maps of the distribution of nutrients in the soil or maps of the relative water content of the soil.
- Placing markers on the web platform and viewing them in the mobile application allowing field inspection of crops and transfer of images and data between users.
- Real-time tracking of the movement of machines and their equipment, as well as visualization of the location, fuel consumption, distance traveled and speed at predefined intervals
- View the working reports of the machines with all the details related to the work in the plots, the consumption per ha on the go or stationary, of the worked surface as well as of the maps covering the plots with the respective works.
- Generating complex reports and exporting them in different formats, manually or pre-programmed by email.
- Real-time visualization of the activity of irrigation pivots and providing details related to: condition, position in the plot, direction of rotation, water rate, speed of movement and water pressure.
- Viewing the activity reports of the pivots, at different time intervals, mentioning the events that occurred, the irrigated area, the duration, the water rate and the total amount of water applied
Advantages

Advantages
Advantages
Advantages
Advantages
Advantages
Contact us
 Close
Close


